Obesity is not only a public health issue, it’s an urban design issue. This project uses spatial data analytics to examine the relationship between obesity rates, walkability, and median household income at the census-tract level in Franklin County, Ohio.
Do more walkable neighborhoods have lower obesity rates?
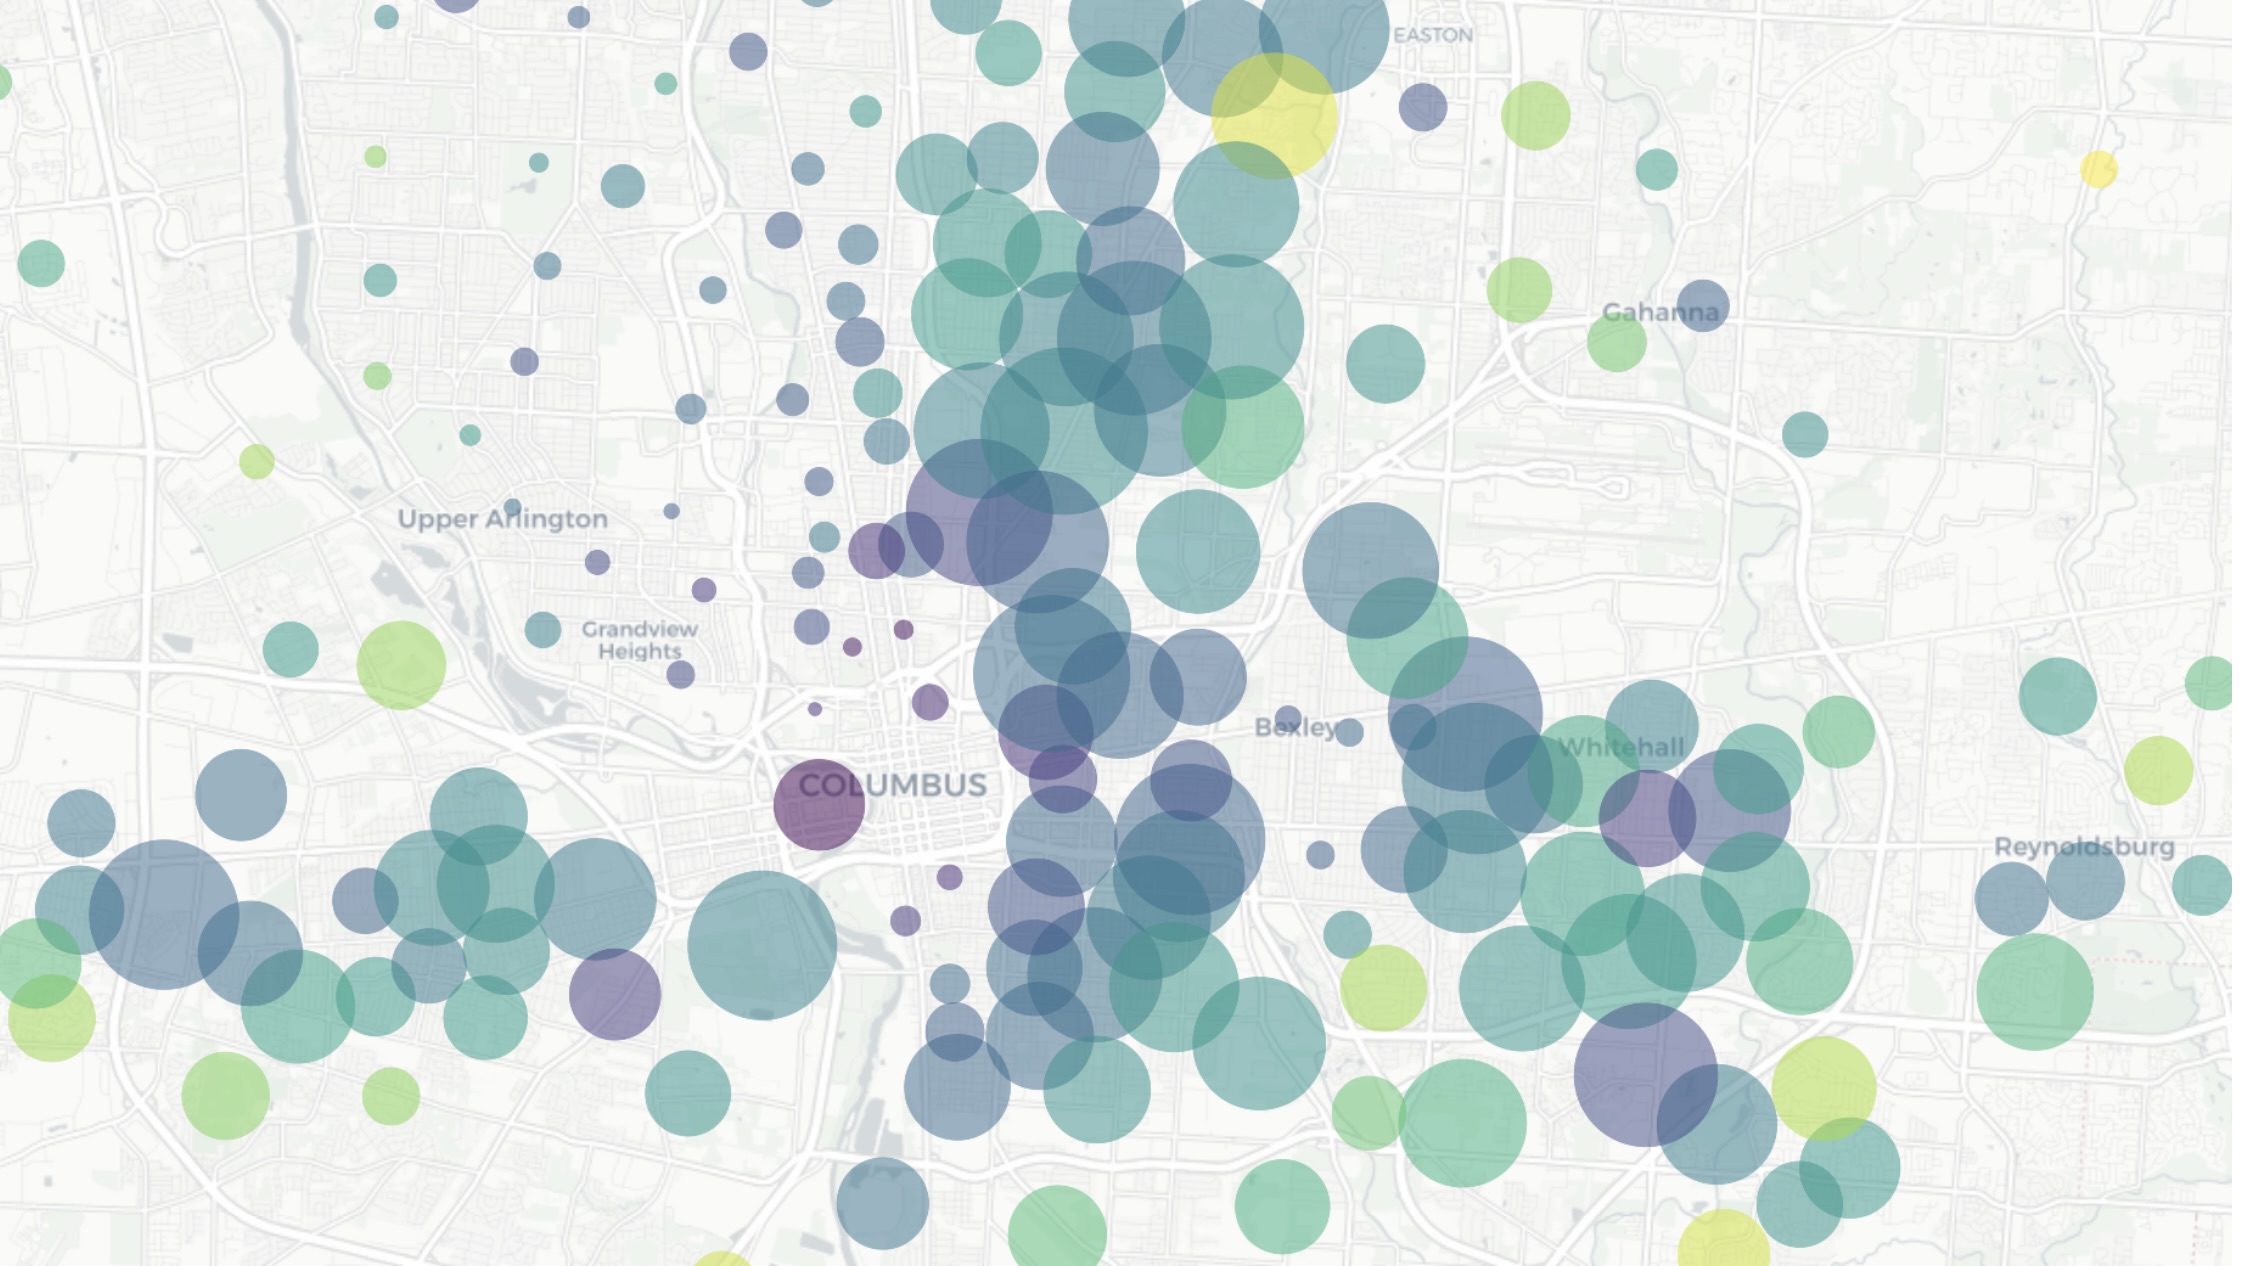
Relation between Obesity and Walkability by Census Tract


The initial results showed walkability had almost no correlation with obesity. Instead of ending there, I expanded the analysis to include income, which revealed a strong, statistically significant relationship.
Do higher-income neighborhoods have lower obesity regardless of walkability?
Relation between Income, Obesity and Walkability by Census Tract

In this dataset, median household income shows a strong negative correlation with obesity, whereas walkability shows little to no correlation at the tract level. Put simply, where incomes are higher, obesity rates tend to be lower, and walkability by itself doesn’t explain much of the variation.
This suggests that economic conditions dominate local obesity patterns, and built-environment upgrades likely need to be paired with equitable access to healthy food, parks, and programs to move the needle. This shift from a null finding to a deeper insight was a key learning moment about the complexity of urban health data.
Key Findings
1. Income and Obesity (Primary Relationship)
Higher-income tracts consistently show lower obesity rates.
The correlation coefficient (r ≈ −0.73) indicates a strong, statistically significant relationship.
2. Walkability and Obesity (Null Relationship)
The correlation between walkability and obesity was weak and statistically insignificant (r ≈ 0.055). Walkability alone does not appear to predict obesity rates in Franklin County.
3. Income, Walkability and Obesity
Overlaying income and walkability suggests that even moderately walkable neighborhoods exhibit higher obesity if incomes are low, emphasizing that economic accessibility outweighs physical accessibility.
The results challenge the common assumption that simply improving walkability will reduce obesity. While pedestrian infrastructure is essential, economic disparities remain the dominant predictor of health outcomes in this dataset.
This underscores the need for multifaceted planning approaches:
- Integrating safe, continuous walking networks with equitable access to healthy food and recreational spaces.
- Recognizing that income inequality and health inequality are deeply intertwined.
Data Sources
- Obesity (CDC PLACES, 2024): Tract-level obesity prevalence.
- Walkability Index (U.S. EPA, 2022): National Walkability dataset.
- Median Household Income (ACS via Census API): 2022 tract-level income data.
- Study Area: Franklin County, Ohio.